Appearance
Appearance
Wireshark is an open-source, cross-platform network packet analyser tool capable of sniffing and investigating live traffic and inspecting packet captures (PCAP). It is commonly used as one of the best packet analysis tools.
Packet capture (PCAP) is a networking practice involving the interception of data packets travelling over a network. Once the packets are captured, they can be stored by IT teams for further analysis. The inspection of these packets allows IT teams to identify issues and solve network problems affecting daily operations.
Packet dissection is also known as protocol dissection, which investigates packet details by decoding available protocols and fields. Wireshark supports a long list of protocols for dissection, and you can also write your dissection scripts. You can find more details on dissection here.
Note: This section covers how Wireshark uses OSI layers to break down packets and how to use these layers for analysis.
Packet Details
You can click on a packet in the packet list pane to open its details (double-click will open details in a new window). Packets consist of 5 to 7 layers based on the OSI model.
We can see seven distinct layers to the packet: frame/packet, source [MAC], source [IP], protocol, protocol errors, application protocol, and application data. Below we will go over the layers in more detail.
The Frame (Layer 1): This will show you what frame/packet you are looking at and details specific to the Physical layer of the OSI model.
.eHKYIKfW.png)
Source [MAC] (Layer 2): This will show you the source and destination MAC Addresses; from the Data Link layer of the OSI model.
![Source [MAC] (Layer 2)](/assets/Source%20_MAC_%20(Layer%202).B6RfxtCW.png)
Source [IP] (Layer 3): This will show you the source and destination IPv4 Addresses; from the Network layer of the OSI model.
![Source [IP] (Layer 3)](/assets/Source%20_IP_%20(Layer%203).Dilyb8pR.png)
Protocol (Layer 4): This will show you details of the protocol used (UDP/TCP) and source and destination ports; from the Transport layer of the OSI model.
.BXl5nRdC.png)
Protocol Errors: This continuation of the 4th layer shows specific segments from TCP that needed to be reassembled.
![Protocol Errors]Pro(<assets/tocol Errors.png>)
Application Protocol (Layer 5): This will show details specific to the protocol used, such as HTTP, FTP, and SMB. From the Application layer of the OSI model.
.BBBUwU-w.png)
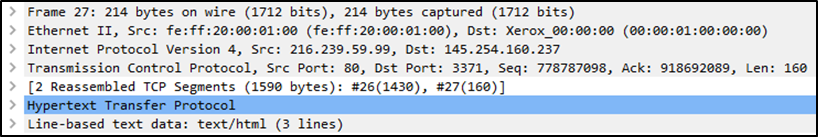
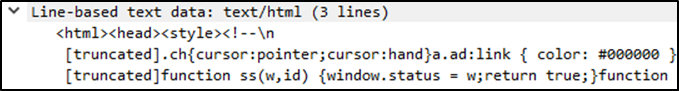
Application Data: This extension of the 5th layer can show the application-specific data.
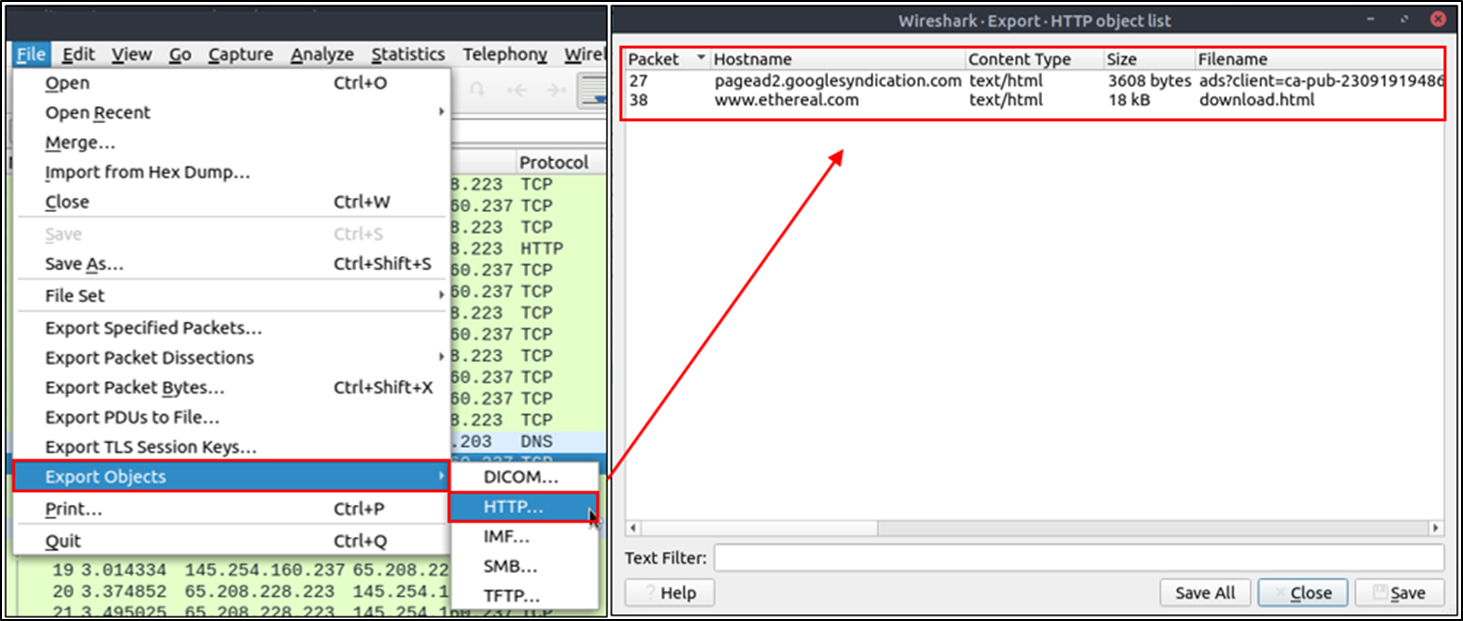
Export Objects (Files)
Wireshark can extract files transferred through the wire. For a security analyst, it is vital to discover shared files and save them for further investigation. Exporting objects are available only for selected protocol's streams (DICOM, HTTP, IMF, SMB and TFTP).
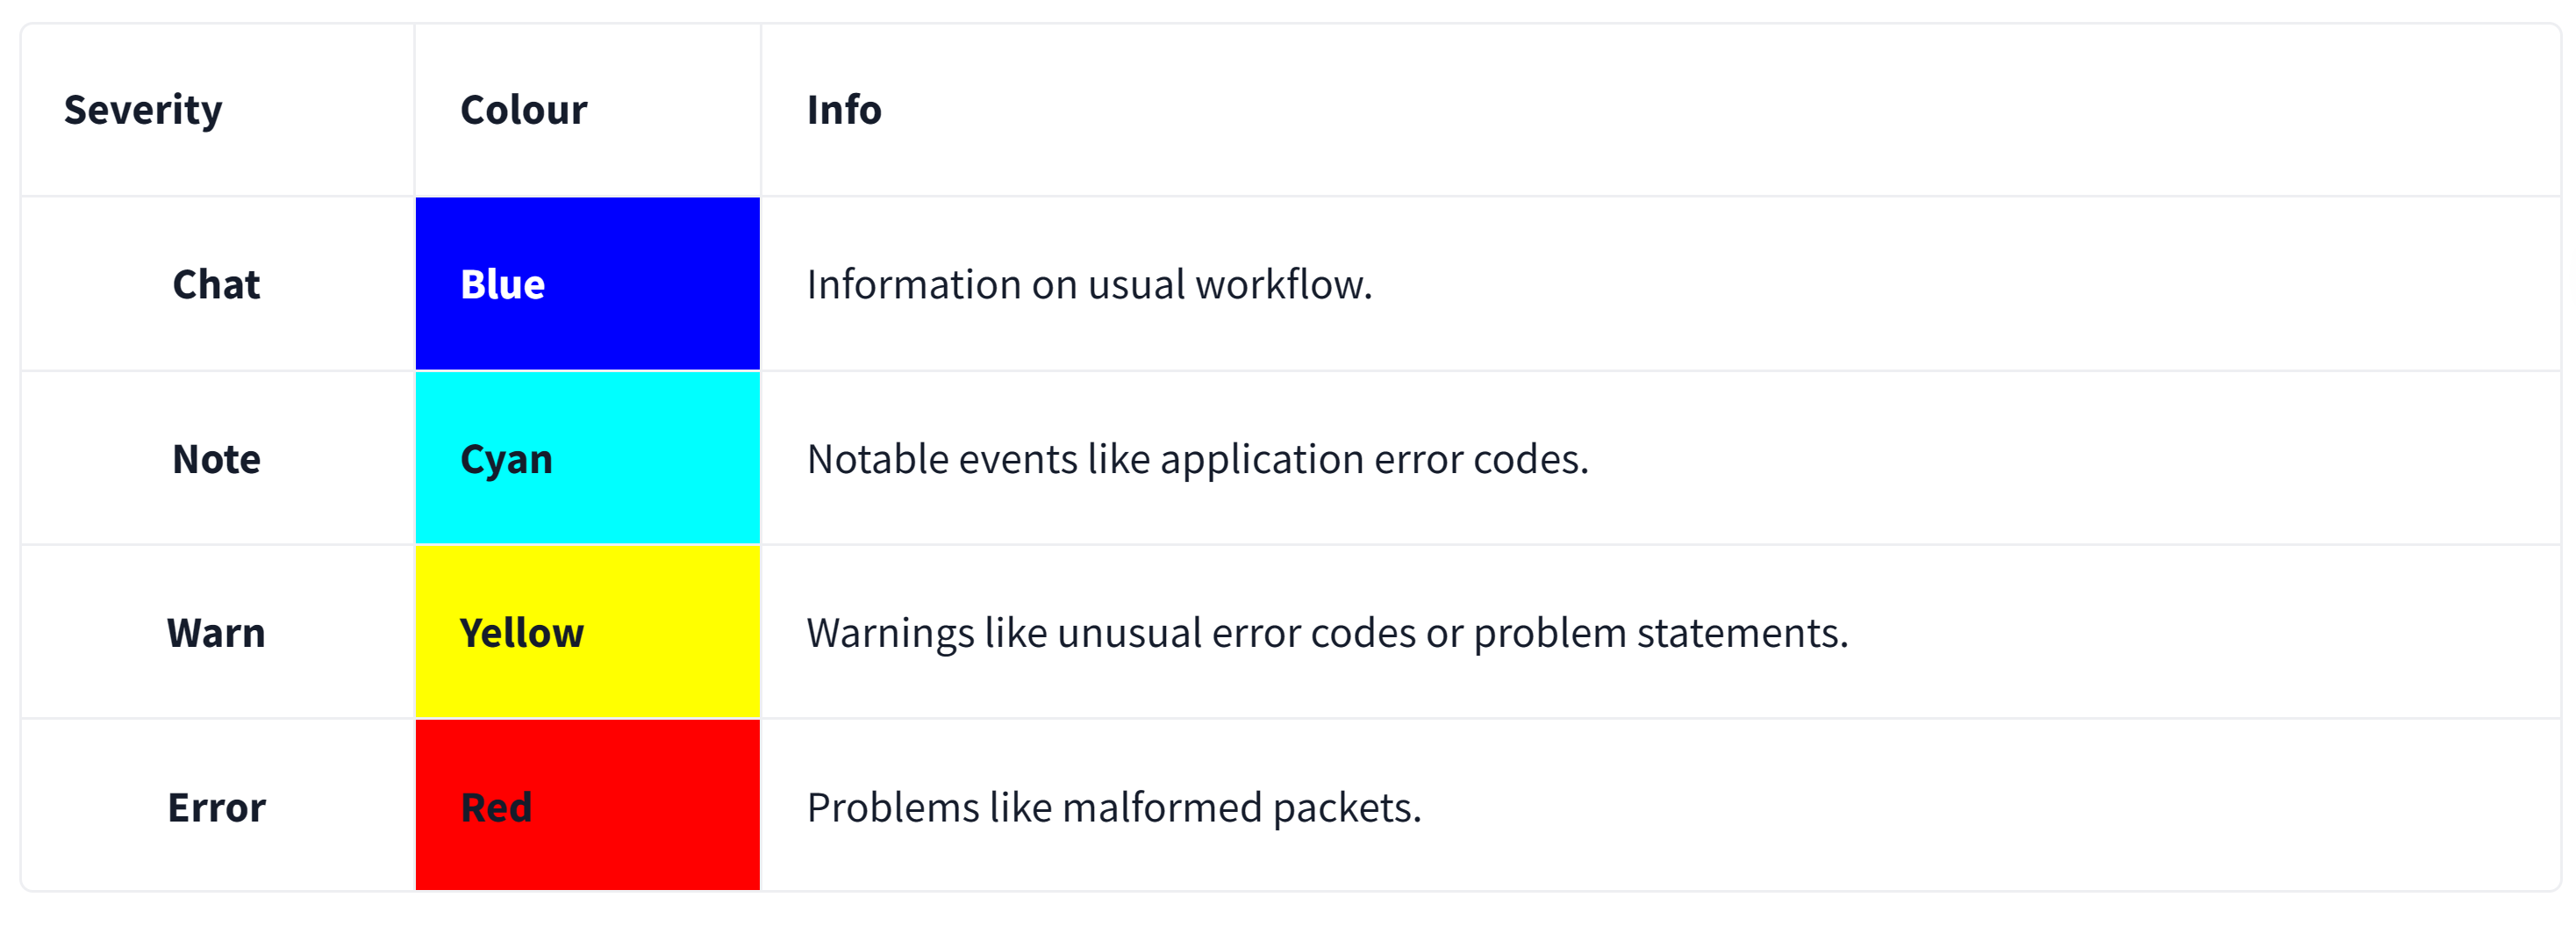
Expert Info
Wireshark also detects specific states of protocols to help analysts easily spot possible anomalies and problems. Note that these are only suggestions, and there is always a chance of having false positives/negatives. Expert info can provide a group of categories in three different severities. Details are shown in the table below.
Wireshark has a powerful filter engine that helps analysts to narrow down the traffic and focus on the event of interest. Wireshark has two types of filtering approaches: capture and display filters. Capture filters are used for "capturing" only the packets valid for the used filter. Display filters are used for "viewing" the packets valid for the used filter. We will discuss these filters' differences and advanced usage in the next room. Now let's focus on basic usage of the display filters, which will help analysts in the first place.
Filters are specific queries designed for protocols available in Wireshark's official protocol reference. While the filters are only the option to investigate the event of interest, there are two different ways to filter traffic and remove the noise from the capture file. The first one uses queries, and the second uses the right-click menu. Wireshark provides a powerful GUI, and there is a golden rule for analysts who don't want to write queries for basic tasks: "If you can click on it, you can filter and copy it"
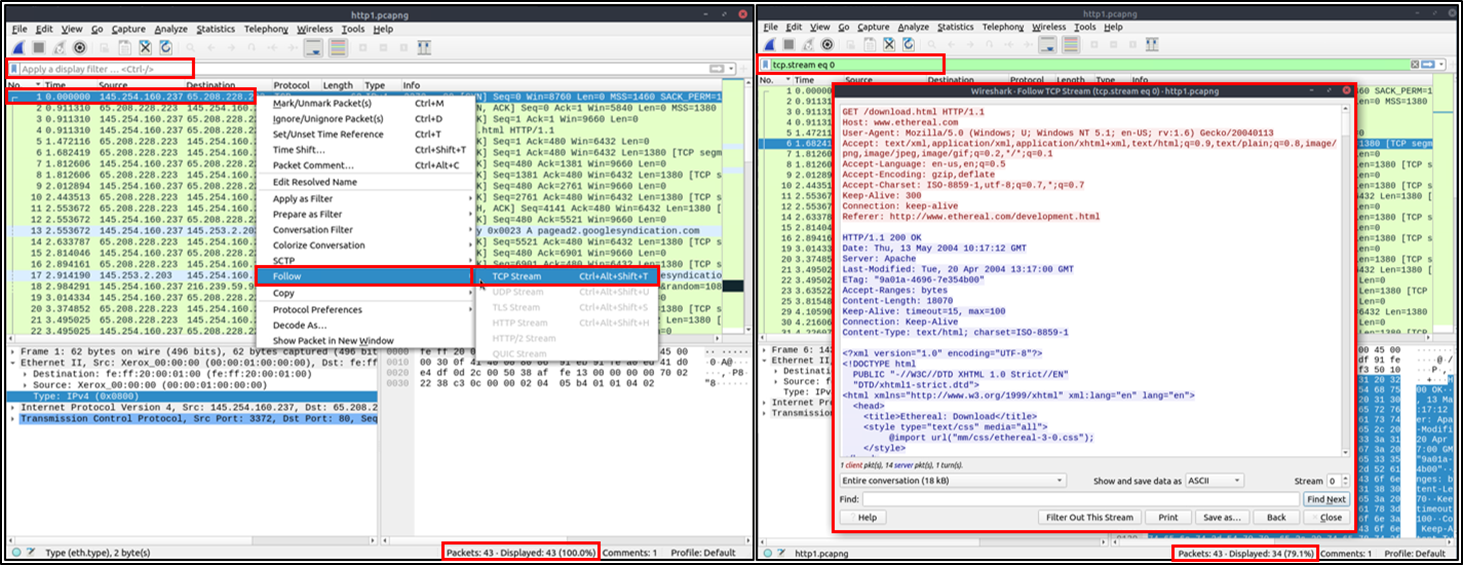
Follow Stream
Wireshark displays everything in packet portion size. However, it is possible to reconstruct the streams and view the raw traffic as it is presented at the application level. Following the protocol, streams help analysts recreate the application-level data and understand the event of interest. It is also possible to view the unencrypted protocol data like usernames, passwords and other transferred data.
You can use the"right-click menu" or "Analyse --> Follow TCP/UDP/HTTP Stream" menu to follow traffic streams. Streams are shown in a separate dialogue box; packets originating from the server are highlighted with blue, and those originating from the client are highlighted with red.